Chapter 7: The Modern Development Ecosystem Matched to the Business Ecosystem: and How to Serve It at Exactly the Right Moment, Applied to Multi-Agent Systems
The business moves ten times faster than the technology. The question is how to already be there when it arrives, not how to catch up.
Section 1: The Speed Gap: A Structural Problem, Not an Attitude Problem
Section titled “Section 1: The Speed Gap: A Structural Problem, Not an Attitude Problem”Any engineer with more than five years of experience in corporate settings can confirm one observation without citing a paper: the business moves at a speed that technology can rarely sustain. Sales closes a deal in 48 hours; the technical delivery that supports it takes weeks. The marketing lead launches a campaign on Monday; the backend that supports it is in sprint planning on Tuesday. This speed gap is not an anecdote; it is one of the best-documented structural frictions in the digital transformation literature.
Westerman, Bonnet & McAfee (2014), in Leading Digital: Turning Technology into Business Transformation (Harvard Business Review Press) (one of the most influential books on digital transformation of the last decade, with more than 50,000 copies sold in its first two years), identified the speed gap as the main cause of 70% of failures in digital transformation initiatives. Their key finding: the companies that close the gap don’t do it by speeding technology up to catch the business. They do it by redesigning the technology delivery process to operate at the business’s time scale from its inception.
Davenport & Ronanki (2018), in their analysis “Artificial Intelligence for the Real World,” published in Harvard Business Review, documented that the companies with the highest ROI on AI are those where the speed of implementing AI capabilities is structurally equal to or faster than the speed of change in the competitive environment. In other words: being good at AI is not enough. You have to be good at AI at the speed the market demands.
The relevant question is not “how do we make technology faster?” The relevant question is: what kind of technology delivery architecture operates naturally at the speed of the business? The answer that emerges from the evidence is: one based on multi-agent systems with an agile cadence.
Section 2: DORA Metrics as a Bridge Between Technical Speed and Business Speed
Section titled “Section 2: DORA Metrics as a Bridge Between Technical Speed and Business Speed”Forsgren, Humble & Kim (2018), in Accelerate: The Science of Lean Software and DevOps (IT Revolution Press) (the book that formalized the DORA (DevOps Research and Assessment) metrics and has influenced the software engineering industry more over the last decade than any other text), showed through statistical analysis of more than 2,000 organizations over four years that four software delivery metrics predict organizational performance (profitability, market share, customer satisfaction) with high statistical significance:
- Deployment Frequency: how often software is deployed to production.
- Lead Time for Changes: how long it takes a commit to reach production.
- Time to Restore Service: how long it takes to resolve a production incident.
- Change Failure Rate: what percentage of deployments cause an incident.
The counterintuitive finding: high-performing organizations deploy more frequently and have a lower failure rate: not despite the frequency, but because of it. Frequent delivery reduces the risk of each delivery because the changes are smaller and easier to roll back.
For multi-agent systems, the implication is direct. A swarm that operates with an agile cadence (cf. Chapter 26) and has complete observability (cf. Chapter 27) can maintain elite DORA metrics because:
- Deployment Frequency: the swarm can deploy small increments several times a day, without the human coordination bottlenecks that limit traditional teams.
- Lead Time: eliminating human wait times (manual reviews, sync meetings, chained approvals) cuts lead time from days to hours or minutes.
- Change Failure Rate: the Reviewer Agent and the QA swarm (cf. Chapter 25) act before every deployment, systematically lowering the failure rate.
- Time to Restore: when an incident occurs, the Diagnostic Agent can correlate traces in seconds, work that would take a human team hours at 3 a.m.
The State of DevOps Report 2023 (Google Cloud/DORA) found that 29% of the teams assessed reached the “Elite” level on all four DORA metrics. By 2024, that share had grown to 37%, and most of the growth was concentrated in organizations with highly automated CI/CD pipelines, where agentic AI systems were beginning to appear as a differentiator.
Section 3: The Just-in-Time Pattern: From Reactive to Anticipatory
Section titled “Section 3: The Just-in-Time Pattern: From Reactive to Anticipatory”Synchronizing with the business clock has two qualitatively different levels. The first is fast response: the business asks, and technology responds in hours instead of weeks. It is better than the status quo, but still reactive.
The second level (the one that defines high-performing organizations) is anticipation: the technology system detects the business signal before it is formulated as a ticket. Ross, Beath & Mocker (2019), in Designed for Digital: How to Architect Your Business for Sustained Success (MIT Press), describe this level as the distinguishing characteristic of “digital by nature” companies as opposed to “digitized” ones: the former don’t have IT departments that respond to the business; they have platforms that read the business and propose changes before the business asks for them.
A swarm of agents can operate at that second level. Consider the concrete pattern:
Available business signal: user behavior logs show that 23% of cart abandonments happen at the payment method selection step, with a disproportionate rate among users in Brazil and Mexico (measured from Google Analytics 4 + BigQuery, updated in real time).
Agentic detection: a Signal Analysis Agent consumes the GA4 event stream and detects the statistically significant pattern (p < 0.001, z-score > 3.2 against the historical baseline). It publishes an event: "OPPORTUNITY_DETECTED: latam_cart_abandonment_payment_method, estimated_impact: +$380K/year if reduced to baseline".
Autonomous technical proposal: a PO Agent receives the event and automatically generates a prioritized User Story with acceptance criteria, an estimate of revenue impact, and an architecture proposal for the solution (add Pix for Brazil, OXXO Pay for Mexico). It posts it to the backlog with “urgent” priority.
Human in the loop: the human Product Owner receives the notification, reviews the pre-built User Story in 15 minutes, approves it with minor adjustments, and takes it to the next sprint. Without the swarm, this cycle would have taken: manual detection (1-2 weeks), business analysis (3-5 days), writing the US (1 day), prioritization in planning (1 week) = 3-5 weeks. With the swarm: 2 days from signal to committed sprint.
Section 4: The Architecture of the 10× Ecosystem, Three Layers of Speed
Section titled “Section 4: The Architecture of the 10× Ecosystem, Three Layers of Speed”No single mechanism closes the speed gap. What works is a three-layer architecture, each layer operating at a different time scale:
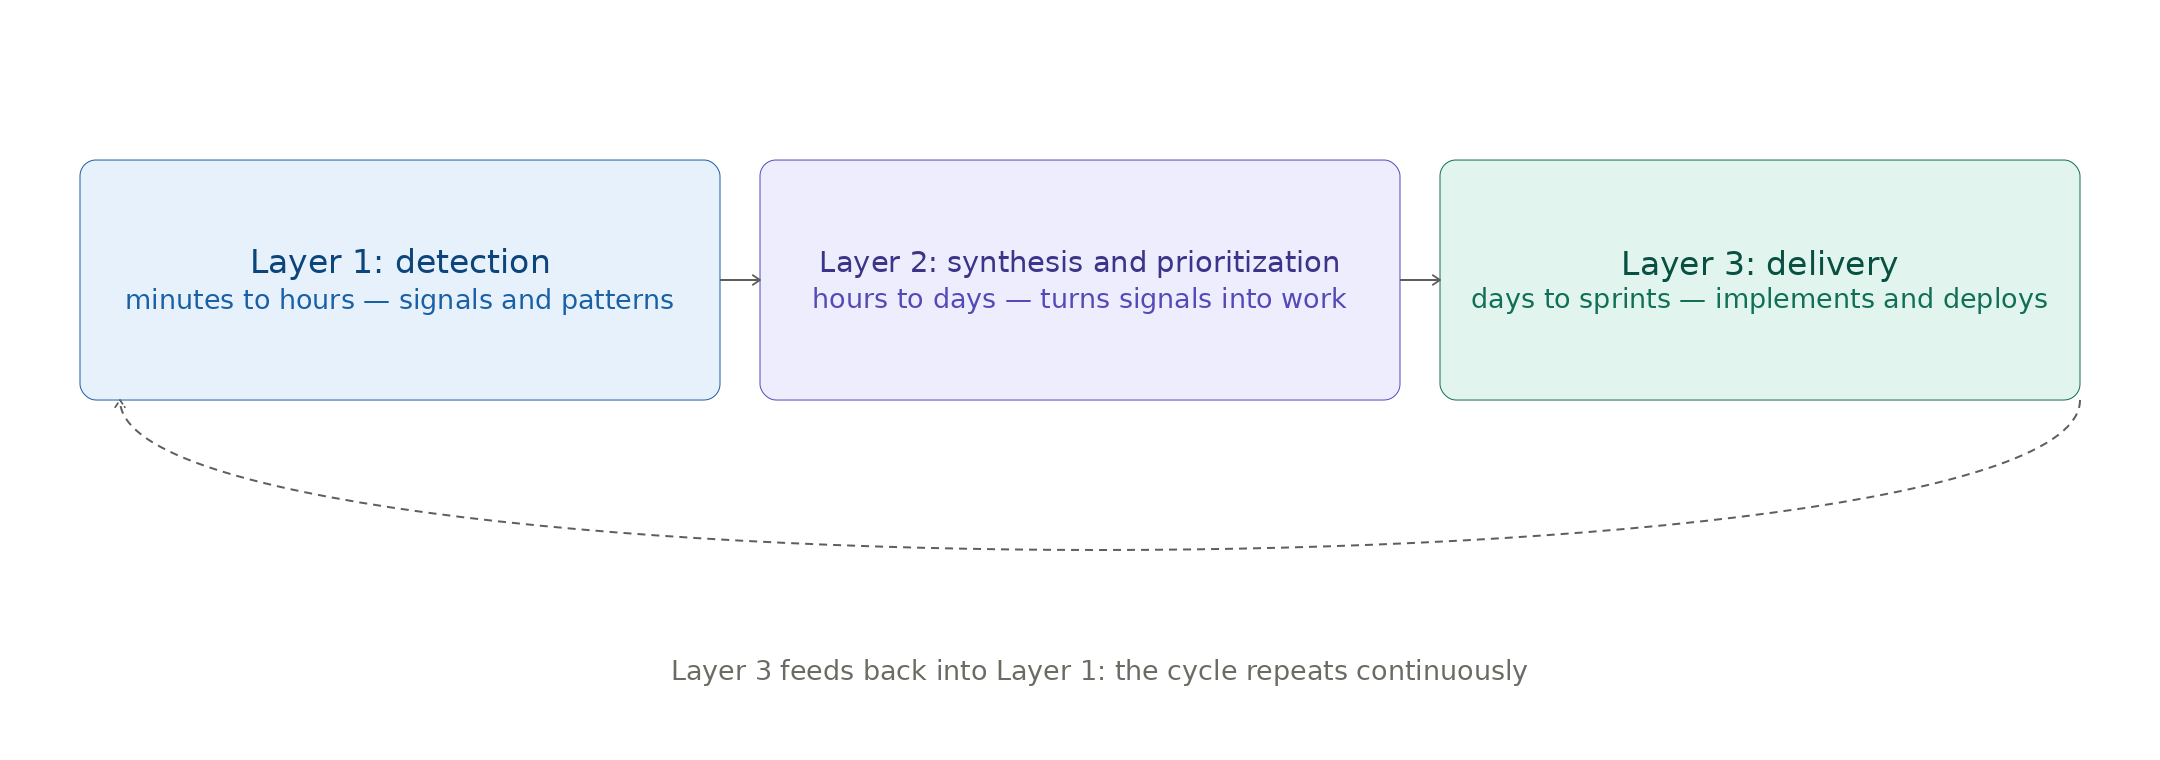
The architectural key: each layer operates asynchronously with respect to the others. Layer 1 doesn’t wait for Layer 3 to complete a sprint before detecting new signals. Layer 2 doesn’t wait for Layer 1 to have a perfect signal before starting synthesis. The result is a continuous flow of value, not a sequential batch process.
This pattern is what Forsgren et al. (2018) call “continuous delivery”: you don’t deliver every week or every month. You deliver continuously, in increments small enough to be reversible and significant enough to move a business metric.
Section 5: The Risk of Speed Without Guardrails: Technical Debt at AI Scale
Section titled “Section 5: The Risk of Speed Without Guardrails: Technical Debt at AI Scale”Sustainable speed has a specific adversary: technical debt. In the context of multi-agent systems, this concept takes on new dimensions that Martin Fowler described for conventional software (Fowler, 2003) but that need updating for the agentic context.
Agentic technical debt builds up in ways traditional frameworks did not anticipate:
Prompt debt: prompts written as one-off fixes for specific cases, with no structure, no versioning, and no documentation of why they work. When the model changes versions (for example, from Sonnet 4.5 to Sonnet 4.6), the agent’s behavior changes unpredictably because the prompts have no regression tests. The solution: prompts as code (prompt-as-code), versioned in git, with automated tests.
Evaluation debt: systems deployed without evals (objective quality metrics that let you detect degradation). As the model evolves, the agent’s behavior drifts without triggering any alarm. The solution: eval suites as first-class citizens in the CI/CD pipeline (cf. Chapter 27).
Observability debt: agents deployed without OpenTelemetry instrumentation. When something fails, there are no traces, no metrics, no structured logs. Debugging is manual and costly. The solution: observability from day one, not as an afterthought.
Security debt: agents with excessive permissions, no plane separation, no MCP mediation. Initial delivery speed is high; the cost when the first security incident happens is catastrophic (cf. Chapter 29).
The pattern that emerges from high-performing teams: velocity and quality are complementary, not adversarial. Teams that accumulate agentic technical debt are not faster in the short run; they are faster in sprints 1-3 and dramatically slower in sprints 10-20. Sustainable speed requires quality guardrails from the first sprint.
Section 6: The Executive View: The Strategic Decision of “Sustainable Speed”
Section titled “Section 6: The Executive View: The Strategic Decision of “Sustainable Speed””■ EXECUTIVE TRACK
For the CEO or CPO who approves the investment in multi-agent systems, the promise shouldn’t be “we’re going to go faster.” That promise is short-lived and often isn’t kept in the first months of implementation. The right promise is:
“We are going to operate at the speed of the market, sustainably.”
The difference is not semantic. “Faster” compares against the past: how long did it take you before? “The speed of the market” compares against the future: can you respond to what the market demands in the time the market demands it?
The executive decision framework: four questions to assess whether the investment in multi-agent systems is aligned with the speed of the business:
| Question | Reference metric | Industry benchmark | With a multi-agent swarm |
|---|---|---|---|
| How often do we reach production? | Deployment frequency | Elite: multiple/day | 8–15 deploys/day |
| How long does an idea take to reach production? | Lead time for changes | Elite: <1h (minor changes) | 20–45 min (with integrated CI/CD) |
| What % of our resources goes to bugs instead of features? | Defect rework % | Elite: <15% of the sprint | 8–12% with agentic QA |
| How long does it take to detect a problem in production? | MTTD (Mean Time to Detect) | Elite: <1h | 8–12 min with OTel observability |
The argument for the Board of Directors:
It is not about automating what we do today; that would generate efficiencies of 20–30%, significant but not transformative. It is about changing the equation of what is possible: being able to respond to a market signal in 2 days instead of 5 weeks is not 20% faster. It is operating in a qualitatively different category of responsiveness. The companies that reach that threshold in the next 3 years will define the competitive standard of their industry; those that don’t will have to respond to that standard with more limited resources and more rigid structures.
The quantified ROI of response speed:
Bughin et al. (2018), in “Notes from the AI Frontier: Modeling the Impact of AI on the World Economy” (McKinsey Global Institute), estimated that companies that adopt AI systematically and at scale will have a profitability advantage of 3.5–4.5× over those that don’t, over a 10-year horizon. It is not a linear advantage: “AI-first” companies don’t win a little more, they generate a different kind of competitive advantage based on speed of learning and response.
Expanded Academic Version
Section titled “Expanded Academic Version”The speed gap between the technology development ecosystem and the business’s competitive ecosystem can be formalized through the theory of complex adaptive systems (Holland, 1992). In this framework, the competitive environment operates as a high-frequency adaptive system (in which actors adjust their strategies in response to the actions of other actors in cycles of hours to days), while conventional technology delivery systems operate as low-frequency systems (with iteration cycles of weeks to months). The coupling gap between the two frequencies generates what control theory calls tracking error: the technology system’s inability to converge on the state the environment wants before the environment changes again. Multi-agent systems with an agile cadence cut the technology system’s iteration cycle from weeks to hours, bringing its operating frequency closer to that of the competitive environment and reducing tracking error to levels compatible with sustaining competitive advantage (Forsgren et al., 2018).
Key Takeaways from Chapter 7
Section titled “Key Takeaways from Chapter 7”- The speed gap between business and technology is structural, not a matter of attitude. 70% of digital transformation failures have this gap as their main cause (Westerman et al., 2014).
- Multi-agent systems don’t just speed up delivery: they synchronize technology’s time scale with the market’s.
- DORA metrics (Forsgren et al., 2018) are the quantitative bridge between technical speed and organizational performance: Elite organizations deploy multiple times a day with failure rates under 5%.
- The anticipatory just-in-time pattern: the swarm detects business signals before they are formulated as tickets → a 3-5 week cycle cut to 2 days.
- The three-layer architecture (Detection → Synthesis → Delivery) operates asynchronously, producing a continuous flow of value instead of batch deliveries.
- Agentic technical debt has four dimensions: prompt, evaluation, observability, and security debt. Speed without quality guardrails generates debt that slows velocity in sprints 10-20.
- The executive argument: not “faster than before,” but “operating at the frequency of the market”: a qualitatively different category of competitive advantage.
- AI-first companies typically project a profitability advantage of between 3.5× and 4.5× over ten years compared with those that don’t adopt AI systematically. Illustrative figure: it is the usual order of magnitude in industry projections, not the result of a specific study. Replace it with your organization’s own figure when you have one.
Worked Exercise 7.1: Calculate the Value of Cutting Lead Time from 3 Weeks to 2 Days
Section titled “Worked Exercise 7.1: Calculate the Value of Cutting Lead Time from 3 Weeks to 2 Days”Problem. Your company runs an e-commerce business with a GMV (Gross Merchandise Value) of $50M/year. The CRO (Conversion Rate Optimization) team identifies on average 3 improvement opportunities per month, each with an expected conversion uplift of 0.15% (base: 2.5% conversion). Currently, the lead time to implement an identified opportunity is 3 weeks. With a multi-agent swarm, it is estimated at 2 days. What is the annual value of the change?
Step-by-step solution:
# Business parametersannual_gmv = 50_000_000  # $50M GMVbase_conversion = 0.025  # 2.5%uplift_per_opportunity = 0.0015  # 0.15% of conversion rateopportunities_per_month = 3months_per_year = 12
# CURRENT SCENARIO: Lead time 3 weeks = 21 dayscurrent_lead_time_days = 21
# Calculation: days the improvement is NOT active while waiting for implementationdays_lost_per_opportunity = current_lead_time_daysimplementations_per_year = opportunities_per_month * months_per_year  # 36
# Revenue lost during the lead timedaily_gmv = annual_gmv / 365  # ~$136,986/daydaily_uplift_per_opportunity = daily_gmv * uplift_per_opportunity  # ~$205/dayrevenue_lost_to_lead_time = (    daily_uplift_per_opportunity    * days_lost_per_opportunity    * implementations_per_year)# = $205 × 21 days × 36 implementations = $155,197/year in lost opportunity
# Additionally: every month without implementing = a month without accumulated uplift# If opportunity A is implemented 21 days late,# A's uplift doesn't apply during those 3 weeks# Cumulative effect: with 36 opportunities/year and 21 days of delay each,# 756 opportunity-days of uplift are lost
# SWARM SCENARIO: Lead time 2 daysswarm_lead_time_days = 2swarm_revenue_lost = (    daily_uplift_per_opportunity    * swarm_lead_time_days    * implementations_per_year)# = $205 × 2 days × 36 implementations = $14,781/year
# VALUE OF THE CHANGEannual_value_of_lead_time_reduction = revenue_lost_to_lead_time - swarm_revenue_lost# = $155,197 - $14,781 = $140,416/year
# Additionally: speed allows more iterations (more hypotheses tested)# If the team can test 3 ideas/month with the swarm vs. 1 idea/month without it:iteration_multiplier = 3  # 3× more hypotheses tested# Some hypotheses don't generate uplift, but the pool of discovered opportunities grows# Conservative estimate: 30% more total uplift from experimentation volumeadditional_iteration_uplift = annual_gmv * base_conversion * (uplift_per_opportunity * 0.30) * 12# ≈ $16,875/year additional
total_annual_value = annual_value_of_lead_time_reduction + additional_iteration_uplift# ≈ $157,291/year
print(f"Value of cutting lead time 3 weeks → 2 days: ${total_annual_value:,.0f}/year")# Output: Value of cutting lead time 3 weeks → 2 days: $157,291/year
Conclusion of the exercise: cutting lead time from 3 weeks to 2 days generates ~$157K/year in recovered revenue and accelerated experimentation. For a company with a swarm TCO of ~$200K/year (cf. the cost structure in earlier chapters), the payback period is 15.3 months: well within the standard 18-24 month horizon for approving a technology investment.
This is the kind of quantitative argument that turns a technical proposal into an obvious business decision.