Chapter 3: Multi-Agent AI Facing El Niño
It is not enough to predict the disaster; the response has to be orchestrated before the water arrives.
Section 1: The Anatomy of the Problem: Beyond Meteorology
Section titled “Section 1: The Anatomy of the Problem: Beyond Meteorology”The El Niño phenomenon (and its coastal variant, El Niño Costero, which strikes the Peruvian coastline with particular violence) is, above all, a complex system. It is not a single event but a chain of interlocking causes: surface temperature anomalies in the central and eastern Pacific Ocean that, weeks later, turn into torrential rain, river overflows, mudslides (huaicos), crop losses, and the collapse of sanitation infrastructure. The 2017 event caused estimated damages of more than USD 3.1 billion in Peru alone (CENEPRED, 2017), a figure the 2023 event threatened to exceed.
The underlying technical problem is not a shortage of data. NASA/ESA’s Sentinel-3 and GOES-East satellites, the more than 300 oceanographic buoys of the Argo system, SENAMHI’s hydrometeorological stations, and the IGP’s ocean circulation models together produce terabytes of information per hour. The break happens at a different level: between those who know, those who decide, and those who act. Between the scientist who detects the SST (sea surface temperature) anomaly in the Niño 3.4 region, the official who must declare the early warning, the mayor who manages the evacuation, and the logistician who moves the resources. Each actor lives in a different institutional silo, works with a different technical vocabulary, and has incentives that rarely line up in real time.
In essence, this challenge is one of distributed orchestration under uncertainty: precisely the domain multi-agent systems were conceived for.
Rolnick et al. (2022), in their comprehensive review published in ACM Computing Surveys (probably the most-cited paper at the intersection of machine learning and climate change, with more than 2,000 citations as of this edition), identified inter-institutional coordination as the main bottleneck in responding to climate disasters, even above predictive accuracy. Put another way: having the right model is no use if the decision chain is broken.
| Problem dimension | Documented evidence | Architectural implication |
|---|---|---|
| Alert latency | El Niño 2017: average time between SENAMHI detection and INDECI alert: 72 hours | We need agents that publish events in real time, not periodic reports |
| Data fragmentation | IGP, ANA, and SENAMHI use incompatible formats (NetCDF vs. CSV vs. proprietary REST APIs) | A mandatory normalization layer (perception agents) |
| Decision-making | COEN, COER, and COEL make decisions in in-person meetings with yesterday’s data | A synthesis and recommendation layer with traceability |
| Regional coordination | Peru, Ecuador, and Colombia manage the same watershed in a disconnected way | A federation of national swarms with interoperability |
Section 2: State of the Art: Predictive AI Applied to Climate Phenomena
Section titled “Section 2: State of the Art: Predictive AI Applied to Climate Phenomena”For decades, numerical weather prediction was the exclusive domain of general circulation models (GCMs) run on high-capacity supercomputers. What happened between 2022 and 2024 changed that paradigm structurally: models based on deep learning began to beat GCMs in both accuracy and speed by margins that ECMWF researchers described as “surprising.”
FourCastNet (Pathak et al., 2022): developed by NVIDIA, this neural network model trained on ERA5 data (ECMWF Reanalysis v5) generates global forecasts of up to 7 days, 45,000 times faster than traditional numerical models while maintaining comparable skill. The threshold was decisive: for the first time, weather prediction could run on edge devices, not just in high-end computing centers.
Pangu-Weather (Bi et al., 2022), published in Nature (impact factor 64.8), was the next step up. Using a three-dimensional Transformer architecture trained on 39 years of ERA5 data, Pangu-Weather outperformed the ECMWF forecast system on 75% of the variables evaluated at a 5-day horizon. As an illustration, its track forecast for Hurricane Dora (2023) was more accurate than that of any existing operational model.
GraphCast (Lam et al., 2022), published in Science (another undisputed Q1 journal, IF 56.9), pushed the limit even further. Trained on the same ERA5 base but with a spatiotemporal graph architecture, GraphCast beat the ECMWF on 90.3% of the 1,380 variables evaluated at 10 days, cutting computation time from hours to under a minute. Its forecast of Cyclone Freddy (2023), the longest-lived in recorded history, was the most dramatic example of predictive capability transferring to extreme domains.
Given all this, the conclusion for a systems architect is unambiguous: predictive accuracy is solved, or on its way to being solved. The shortfall is not in the model; it is in the chain that uses the model. None of these three systems (FourCastNet, Pangu-Weather, GraphCast) comes with a built-in mechanism for institutional coordination. They produce numbers; they don’t coordinate evacuations.
Irrgang et al. (2021), in Nature Machine Intelligence, introduce the concept of “neural Earth system modelling”: integrating AI into Earth science workflows not as a substitute for physical models but as a complement. What matters for this chapter is that the authors document that the main barrier to adoption is organizational, not technical (the data exists, the models exist, but the cross-agency integration pipelines do not). This is exactly the gap a multi-agent system can close.
Section 3: Expanded Technical Architecture: The Four Layers in Detail
Section titled “Section 3: Expanded Technical Architecture: The Four Layers in Detail”► TECHNICAL TRACK
Figure 3.1 summarizes the complete architecture before we get into the detail of each layer: raw data enters from the bottom, passes through perception and specialized reasoning, is synthesized in the orchestration layer, and reaches the human already turned into a traceable recommendation, never an order.
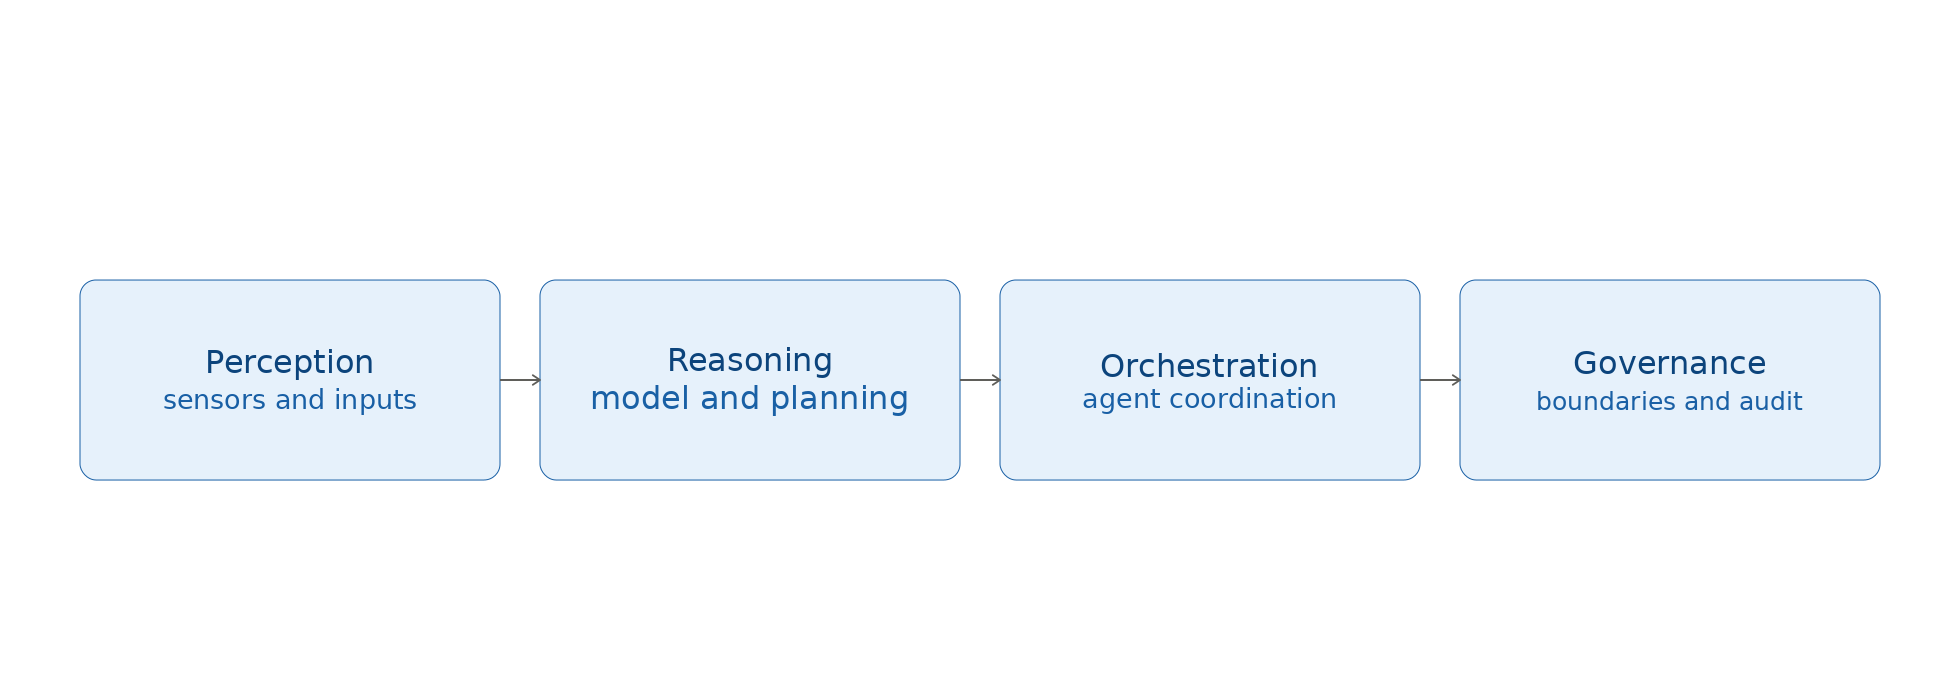
Note that the arrows between layers are bidirectional only between Orchestration and Governance: the human can reject a recommendation and force a new synthesis, but never writes directly into the reasoning layer. This asymmetry is deliberate. It is the mechanism that keeps human oversight from becoming an operational bottleneck while it remains the final authority.
Layer 1: Perception: Normalizing a Heterogeneous Reality
Section titled “Layer 1: Perception: Normalizing a Heterogeneous Reality”Perception agents are the system’s translators. Their job is to transform raw, heterogeneous data into a shared semantic format, not to reason. Technically, they implement the Anti-Corruption Layer pattern (Fowler, 2003) applied to climate data.
Each perception agent connects to a specific source through the Model Context Protocol (MCP, Anthropic 2024), which guarantees the agent never handles access credentials directly (these are mediated by the MCP server with OAuth2 authentication and audit logging). The formats ingested include:
- NetCDF (SENAMHI, IGP): files of multidimensional climate variables with spatiotemporal coordinates. The perception agent converts them to normalized geospatial JSON with UTC timestamps.
- CSV and XLSX (ANA, INDECI): hydrometeorological station files. The agent maps them to the internal event schema of the message bus.
- REST APIs (NASA EOSDIS, ESA Copernicus): JSON responses with satellite imagery and sea level data. The agent normalizes and georeferences them.
- MQTT streams (IoT streamflow sensors in watersheds): low-latency messages that the agent converts into Kafka events with signal quality metadata.
The guiding principle: a single internal data contract. Everything that enters the event bus has the same schema, regardless of its original source.
Layer 2: Specialized Reasoning: The Synthetic Experts
Section titled “Layer 2: Specialized Reasoning: The Synthetic Experts”This layer houses four specialized agents, each trained (through fine-tuning or highly specific system prompting) in a different domain:
Hydrological Agent. Its domain is the water cycle: flows, overflow thresholds, and watershed models. It consumes the perception agent’s events for SENAMHI and ANA, runs watershed time-of-concentration calculations (Kirpich’s formula: Tc = 0.0195 × (L³/H)^0.385, where L is the channel length in meters and H is the elevation difference), and publishes events such as "Rímac River: 95th percentile flow in 18h, confidence: 0.87".
Epidemiological Agent. It activates after a hydrological alert. The outbreaks of dengue, leptospirosis, and cholera that follow floods follow documented patterns (PAHO/WHO, historical series 2000-2023). This agent crosses the projected flood maps with records of active vectors (Aedes aegypti, breeding sites) and publishes geolocated health risk alerts with a 15-day horizon.
Logistics Agent. Its role is to optimize relief routes under the constraint of degraded infrastructure. It implements a variant of the Vehicle Routing Problem with Time Windows (VRPTW), solved with metaheuristic algorithms (Simulated Annealing for instances under 200 nodes, scaling to Tabu Search for larger ones). It publishes the optimal plan for distributing drinking water, food, and medicine to the zones of projected impact.
Agricultural Agent. It estimates crop losses by crossing flood projections with the map of crops in production (MIDAGRI data). Its outputs feed both the logistics plan (which areas will need food support) and the damage assessment for the emergency declaration.
Layer 3: Orchestration and Consensus: Where the Swarm Decides
Section titled “Layer 3: Orchestration and Consensus: Where the Swarm Decides”An Apache Kafka event bus acts as the nervous system. Each Layer 2 agent is both a consumer and a producer: it reads events from the bus, processes them in its domain, and publishes its conclusions as new events. The Coordinator Agent aggregates these conclusions using an uncertainty-based weighting scheme (events with a higher confidence score carry more weight in the final recommendation).
Critically, there is a Critic Agent whose function is adversarial: its only job is to identify inconsistencies among the conclusions of the specialized agents. Does the hydrological agent project an overflow in 18 hours while the logistics agent plans routes through that same zone? The Critic Agent detects the contradiction and publishes a conflict event that forces renegotiation. This mechanism implements, in the software domain, Popper’s principle of falsifiability: a conclusion is worth the refutations it has survived (cf. Chapter 25).
Layer 4: Human Governance: The Machine Supports, the Human Signs
Section titled “Layer 4: Human Governance: The Machine Supports, the Human Signs”No agent in the system issues evacuation orders. Layer 4 puts the Human-in-the-Loop principle into its strictest form: the swarm delivers recommendations, not decisions. Each recommendation comes with:
- An aggregate confidence level (0–1 scale, calibrated through reliability diagrams on the prediction history).
- A traceable chain of evidence: which data led to which conclusion in which agent.
- Alternative scenarios: the highest-confidence recommendation plus the two lowest-cost alternatives if the main one fails.
Decision-makers at the COEN (National Emergency Operations Center) work with a dashboard that shows these recommendations in natural language, with interactive maps and the full traceability one click away. The official signs the evacuation; the system prepared it.
Section 4: The Senior Engineer and QA View: System Reliability Under Pressure
Section titled “Section 4: The Senior Engineer and QA View: System Reliability Under Pressure”► TECHNICAL TRACK
A disaster management system that fails during the disaster is, at best, useless; at worst, counterproductive. Reliability is not an optional feature: it is the central feature.
Validation by historical backtesting. The most robust testing strategy available for this kind of system is to run it against historical data from past events (El Niño 1997-1998, El Niño Costero 2017) and measure whether its recommendations would have been correct. The relevant metrics are not those of a generic classifier: they are the Brier Score (probability calibration), Resolution (the ability to discriminate between events), and the Reliability Diagram (when the agent says “90% probability,” is it right 90% of the time?). A hydrological agent with a Brier Score above 0.25 on historical events must not be deployed to production.
Redundancy and fail-safe. The architecture implements redundancy in Layer 1 (three perception agents per critical source, 2-of-3 consensus) and graceful degradation in Layer 2: if the epidemiological agent doesn’t respond within 30 seconds, the Coordinator continues with the conclusions of the other three agents and labels the final recommendation “Epidemiological analysis unavailable, reduced confidence.”
End-to-end latency monitoring. The system’s promise is to cut the time between anomaly detection and the official alert recommendation from 72 hours (the 2024 status quo) to 6 hours. That promise requires explicit Service Level Objectives (SLOs) at each layer: P99 Layer 1 latency < 5min, P99 Layer 2 < 15min, Layer 3 synthesis < 5min. If any SLO is violated, the system alerts the operations team before the incident spreads.
Adversarial injection testing. Weather data can be tampered with (a faulty sensor, a value transmitted with a unit error, or, in more sophisticated scenarios, deliberate manipulation). The ingestion pipeline runs statistical anomaly detection (z-score > 3.5 for historically stable variables) before the data reaches the event bus. A perception agent that detects an out-of-range value marks it confidence: 0.0 and publishes it anyway (for the audit record) but leaves it out of the synthesis calculation.
Section 5: The Executive View: ROI, Budget, and Life Cycle
Section titled “Section 5: The Executive View: ROI, Budget, and Life Cycle”■ EXECUTIVE TRACK
For INDECI’s Executive Director or the Minister of Economy who has to approve the budget, the technical argument is not enough. What matters is the value equation: how much does this system cost compared with how much it saves?
The cost of not acting is not hypothetical. El Niño Costero 2017 caused damages quantified at USD 3.1 billion according to ECLAC (2017). The COEN’s average response time was 72 hours from the detection of the anomaly to the first official evacuation order. In that period, most of the damage was already unavoidable.
A conservative analysis: cutting response time from 72 to 6 hours would allow preventive evacuation of 40% of the high-impact zones before the peak (an estimate based on transport times documented by INDECI, 2018). On USD 3.1 billion in damages, that represents a potential saving of USD 620 million per severe event.
System TCO (Total Cost of Ownership, 5-year horizon):
| Component | Year 1 (Implementation) | Years 2-5 (Operation) |
|---|---|---|
| Cloud infrastructure (Kafka, K8s, models) | USD 180,000 | USD 60,000/year |
| SENAMHI/IGP/ANA API integration | USD 120,000 | USD 20,000/year |
| Fine-tuning specialized models | USD 80,000 | USD 30,000/year (updates) |
| COEN/COER training | USD 40,000 | USD 15,000/year |
| Total | USD 420,000 | USD 125,000/year |
5-year TCO: USD 920,000. Potential saving from one severe event: USD 620M. ROI ratio: 673:1.
This is not utopia: it is value engineering. The argument to the budget committee is “we want to reduce the expected cost of a severe El Niño by USD 620M with a 5-year investment of USD 920K,” not “we want to do AI.”
Executive roadmap:
- Phase 0 (Months 1-3): Diagnosis of the SENAMHI, IGP, and ANA APIs and data formats. Definition of SLOs.
- Phase 1 (Months 4-9): PoC with the Hydrological Agent + Coordinator Agent. Validation with historical data.
- Phase 2 (Months 10-18): Regional pilot deployment (Chira-Piura and Huallaga basins). Integration with the COEN.
- Phase 3 (Months 19-30): National expansion + interoperability with Ecuador and Colombia.
Section 6: A Cross-Border Case: The Panama Canal and Water Rationing
Section titled “Section 6: A Cross-Border Case: The Panama Canal and Water Rationing”■ EXECUTIVE TRACK
The same underlying problem (distributed orchestration under climate uncertainty) is not unique to disaster management. It shows up, in another guise, in any critical infrastructure that depends on a shared water resource. The case of the Panama Canal in 2026 illustrates it with unusual clarity, because it is unfolding in real time as this chapter is written.
The Canal operates with two reservoirs (Gatún and Alajuela) whose levels determine how many ships can transit per day and with what maximum draft. Each transit consumes several million gallons of fresh water, the same resource that supplies half of Panama’s population. In August 2026, rainfall in the basin fell 34% below the historical average, and Gatún Lake stood just below its five-year average for that date (Panama Canal Authority, August 2026). In its ENSO diagnostic discussion of September 10, 2026, NOAA’s Climate Prediction Center estimated a probability above 90% that El Niño will reach the “very strong” category during the boreal fall and winter of 2026-27, and a 75% chance that it will exceed in intensity all events recorded since 1950 (NOAA Climate Prediction Center, 2026). The ACP’s response was to reduce daily transits from 36 to 34 starting September 3, and to 32 starting the 15th (ACP, 2026), a restriction that is still mild compared with the 2023-2024 crisis, when the lake level forced a cut from 38 daily transits to just 18, with losses that rippled through global supply chains for months.
What matters for this chapter is that the four-layer architecture described in Section 3 carries over almost unchanged:
- Perception. The same agents that normalize NetCDF and MQTT streams in the Peruvian basin can ingest the level telemetry from Gatún and Alajuela, NOAA’s ENSO forecasts, and the shipping lines’ transit reservation queue, mapping everything to a common schema via MCP.
- Specialized reasoning. A Hydrological Agent (identical in function to the one in Section 3, retrained on the Canal’s basin) projects the lake level trajectory at 30 and 90 days. Alongside it runs a Transit Scheduling Agent, which solves a different variant than the VRPTW of Section 3: a bin packing problem with a water budget constraint, where each daily slot has an available volume of water and each reserved vessel consumes a share of that volume according to its draft and the number of simultaneous lockages it allows.
- Orchestration and consensus. Here is the piece that really matters: a Critic Agent that compares the hydrological projection with the calendar of already confirmed reservations. If the hydrological agent revises its level projection downward (as happened several times during 2023) and the transit calendar still assumes the earlier availability, the Critic Agent raises the same kind of temporal conflict we saw in Exercise 3.1, forcing a renegotiation of slot allocation before the scarcity becomes an operational crisis announced with only a few days of margin.
- Human governance. The ACP signs the restriction; the system gives it the recommendation with the forecast’s confidence level and the opportunity cost of each scenario (lost toll revenue versus the risk of shortage).
The pattern that emerges (call it Adaptive Rationing under Hydroclimatic Uncertainty) is portable to any infrastructure that allocates a scarce resource among claimants with different ability to pay and different urgency: a hydroelectric dam, an agricultural irrigation network, an aquifer shared between municipalities. The engineering lesson is the same one that closes Section 5: the value is not in predicting the climate better (GraphCast and Pangu-Weather already handle that), it is in having the orchestration and governance architecture that turns that prediction into a defensible decision before the resource runs out.
And here it is worth being explicit about something this book has maintained since the first chapter: this architecture keeps its value regardless of which specific model reasons in Layer 2. If tomorrow a new model (from OpenAI, Anthropic, or any other provider) turns out to be cheaper or more accurate at hydrological forecasting, the corresponding agent is replaced without touching the rest of the system, as long as the Agnostic Backend principle (cf. Vol. 2) has been respected. The competitive advantage depends on having built the harness that lets you adopt that model the same day it ships, without rewriting the orchestration; chasing the model of the week pays off far less than that.
Expanded Academic Version
Section titled “Expanded Academic Version”This section offers a restatement of the chapter’s central concepts at a higher academic density, aimed at research audiences or presentations to high-level technical committees.
From a complex systems perspective, the ENSO (El Niño–Southern Oscillation) phenomenon is a low-dimensional chaotic attractor whose emergent dynamics have been characterized through dimensionality reduction techniques (Empirical Orthogonal Functions, EOF) on satellite sea surface temperature (SST) data. The shift from purely numerical prediction architectures toward neuro-physical hybrids, as Irrgang et al. (2021) document in Nature Machine Intelligence, introduces a methodological disruption: deep learning models do not replace the system’s physics but learn the residuals the physical model does not capture, compressing the error space far more efficiently.
In terms of multi-agent systems engineering applied to disaster management, the architecture described fits within the paradigm of Heterogeneous Multi-Agent Systems (HMADS), where the heterogeneity of the agents (distinct epistemic domains, differentiated technical vocabularies, divergent reasoning time horizons) is not a limitation but the basis of the swarm’s computational richness. Emergent consensus among heterogeneous agents under an uncertainty-weighted protocol (Bayesian Model Averaging, BMA) produces calibrated estimates of a higher quality than any individual agent, a phenomenon documented in the ensemble learning literature since the seminal work of Breiman (1996) and formalized for multi-agent systems by Wooldridge & Jennings (1995) in The Knowledge Engineering Review.
Key Takeaways from Chapter 3
Section titled “Key Takeaways from Chapter 3”- El Niño is a problem of distributed orchestration under uncertainty, not of data scarcity.
- FourCastNet, Pangu-Weather, and GraphCast have solved short-term prediction: the deficit is in the institutional decision chain, not in the science.
- The four-layer architecture (Perception → Reasoning → Orchestration → Governance) separates domains of responsibility with no direct coupling between them.
- The adversarial Critic Agent is the most important piece of the design: a recommendation is worth the number of refutations it has survived.
- The human signs the evacuation; the system backs it with traceability and a chain of evidence.
- The conservative ROI is 673:1 against the 5-year TCO for one severe event.
- Regional interoperability (Peru, Ecuador, Colombia, Chile) turns national swarms into a cross-border confederation.
- Reliability is validated with historical backtesting on El Niño 1997-98 and 2017, not only with synthetic tests.
- The same four-layer architecture, unmodified, solves water rationing at the Panama Canal under El Niño 2026: what gets reused is the pattern; the model that reasons inside it is interchangeable.
Worked Exercise 3.1: Design the Critic Agent
Section titled “Worked Exercise 3.1: Design the Critic Agent”Problem. The Hydrological Agent publishes the event: {"river": "Piura", "overflow_prob": 0.91, "horizon_hours": 20, "confidence": 0.88}. At the same time, the Logistics Agent publishes: {"main_route": "Piura-Paita Highway", "estimated_evacuation_time": 26, "route_status": "passable"}. The Critic Agent must detect the conflict. What logic does it implement, and what does it publish?
Solution.
The Critic Agent implements a temporal consistency check: if overflow_prob > 0.85 and horizon_hours < estimated_evacuation_time, the proposed logistics plan is physically incoherent (the evacuation would arrive after the overflow).
def detect_conflict(hydrological_event, logistics_event):    prob_threshold = 0.85    safety_margin_hours = 4  # minimum operational buffer
    if (hydrological_event["overflow_prob"] > prob_threshold and        hydrological_event["horizon_hours"] <        (logistics_event["estimated_evacuation_time"] + safety_margin_hours)):
        return {            "type": "TEMPORAL_CONFLICT",            "description": "The overflow horizon (20h) is shorter than the evacuation time (26h + 4h margin = 30h)",            "agents_involved": ["hydrological", "logistics"],            "suggested_action": "Find an alternative evacuation route OR shorten the action horizon",            "priority": "CRITICAL",            "timestamp": "2025-01-15T03:45:00Z"        }
The Coordinator receives this conflict event, suspends the evacuation recommendation via the Piura-Paita Highway, and asks the Logistics Agent for an alternative plan with routes that can be completed in under 16 hours. Only when the Critic Agent detects no conflicts in the new proposal does the recommendation move up to Layer 4.
The lesson: the Critic Agent doesn’t make the system slower; it makes the system more reliable. An incoherent plan that reaches the COEN at time zero is more harmful than a correct plan that arrives an hour later.